
Interested in advertising on Manebooru? Click here for information!

Hosting an imageboard costs money - help support us financially!
Description:
Auto-imported from (2256362)
Upvotes at import: 14 | Stars at import: 9
Posted previously at: 2020-01-25T06:35:25 | Posted previously by: mortarroad
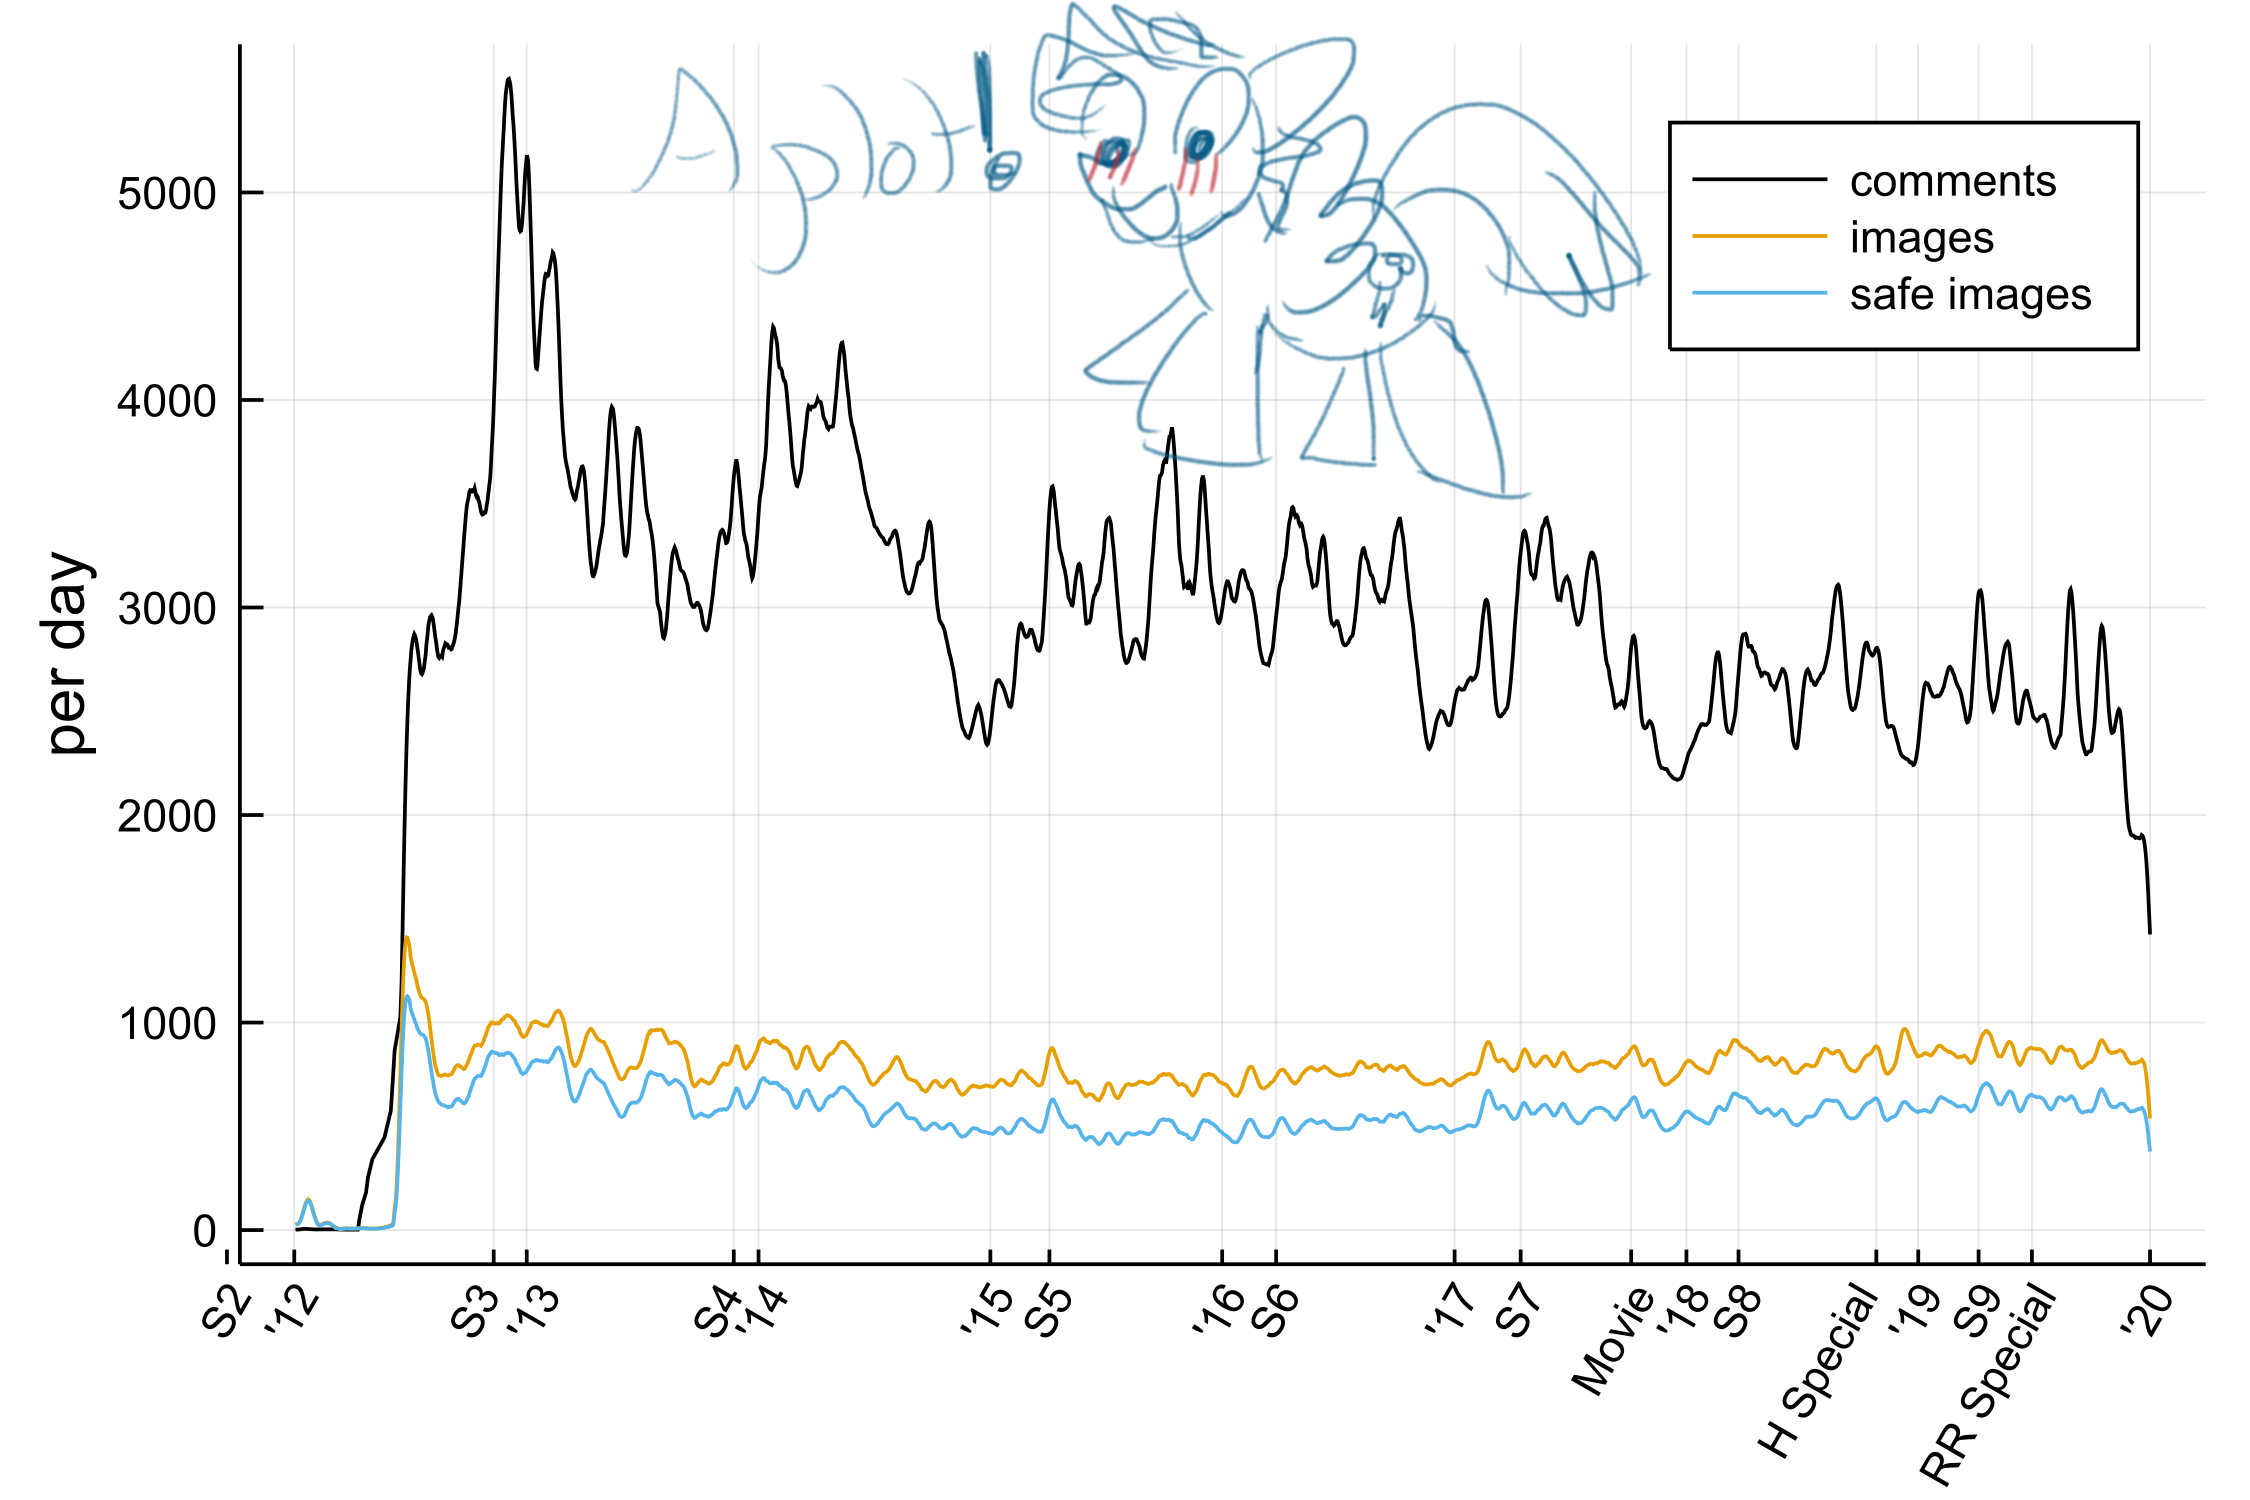
I guess I'm not the first one to make such a graph, but mine has Dashie in it!
It shows the number of comments, image uploads and safe image uploads per day.
Surprisingly, the comments fluctuate a lot more, while uploads stay pretty consistent.
Si denote the seasons, 'nn denote the years.
Upvotes at import: 14 | Stars at import: 9
Posted previously at: 2020-01-25T06:35:25 | Posted previously by: mortarroad
not provided yet
Comments
0 comments posted